Covid Monitoring Tool
Introduction
One of the projects that I am actively working on as a core developer while working in Acumen LLC is Covid Monitoring Tool. This tool is to conduct surveillance on the spread of the COVID-19 and address spatio-temporal patterns. This data agnostic tool is currently deployed and accessbile to multiple clients with different data tailored.
Tech Stack
- Javascript
- D3.js for the interactive visualizations
- Vue.js, Vuex and Vue-Router
- Webpack
- Bootstrap and BootstrapVue
- ag-Grid for table
- PostgreSQL
- Git and Github for version control and team collaboration
- Upsource for code review
- Jira for task tracking and Agile process
- Confluence for documentation
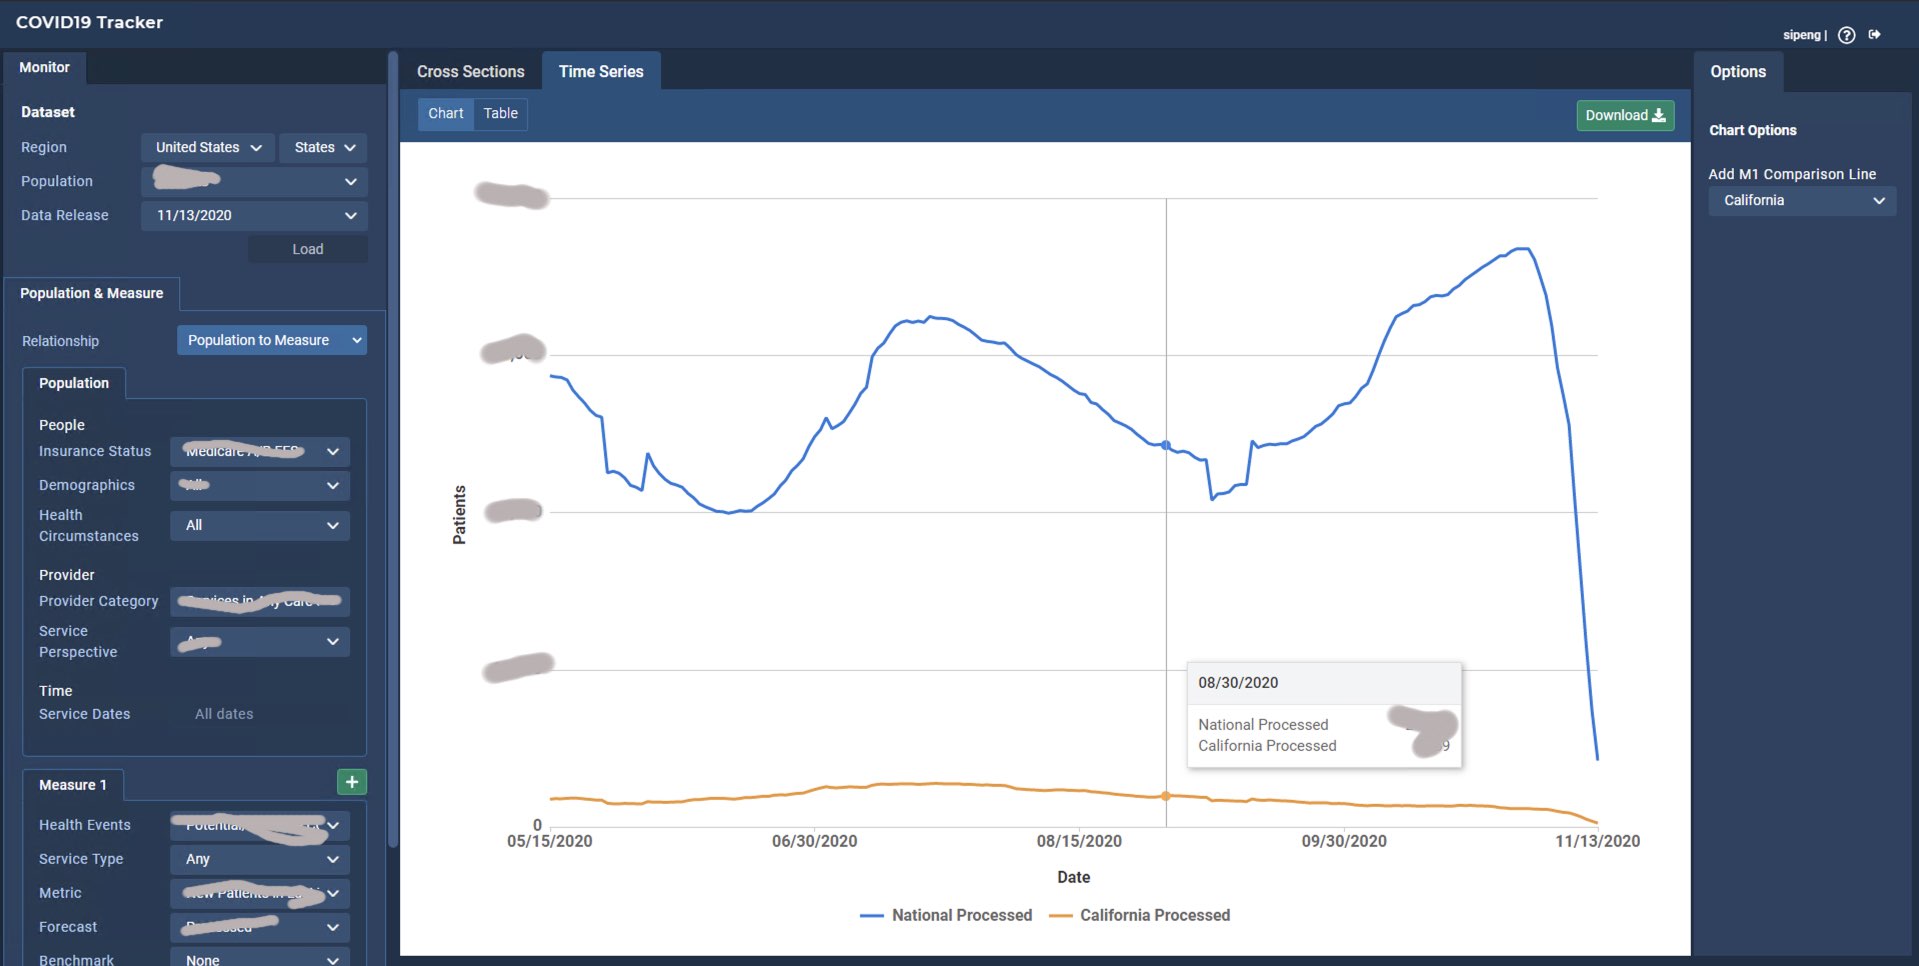
Screenshot of current work:
Due to greater data security, unfortunately I am not able to public the data, and functional graphic.

Key Takeaways
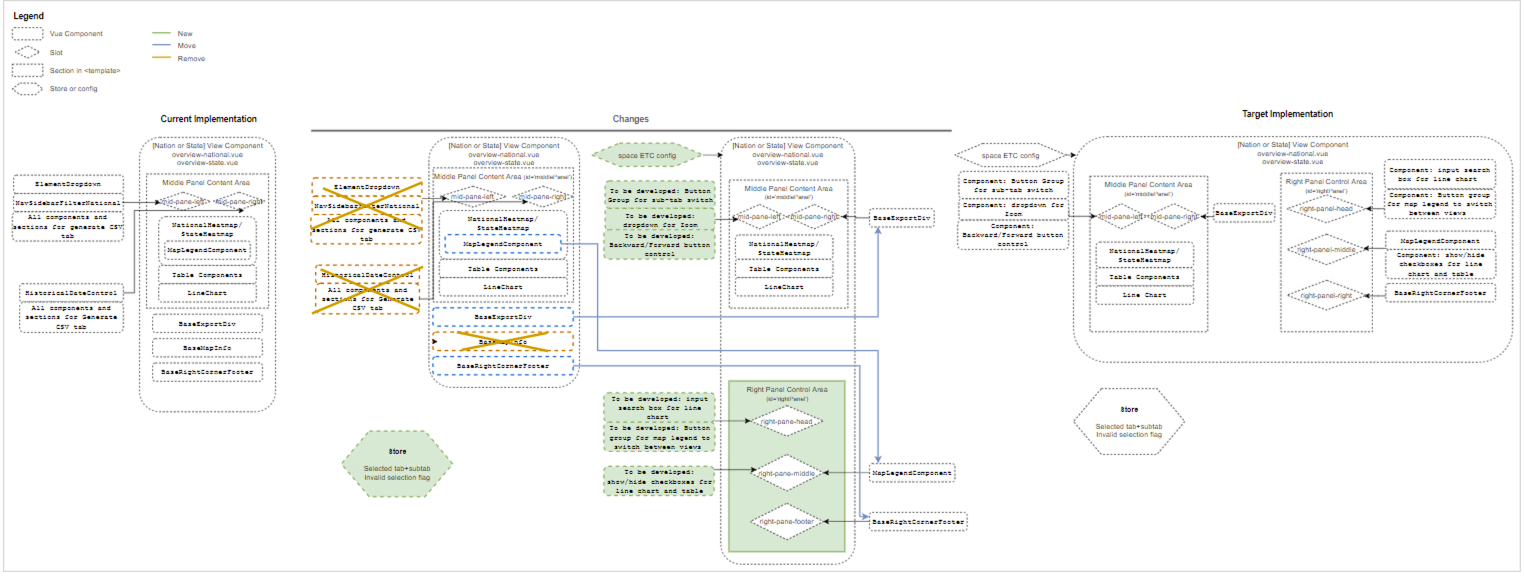
One process that I took the lead on is the code base refactoring, so that the
tool can fit in with new design requirement, overall layout change and data model changes.
Some key efforts made includes:
- Re-architect the flow of tab rendering and generating using config-driven process and give the controls and flexinilities to users.
- Re-designed the tab component, organized the template.
- Create new components and adjust props/data flows of current components.
- Sync the tab navigation with URL change.
- Using Vuex to save user selection on current view.

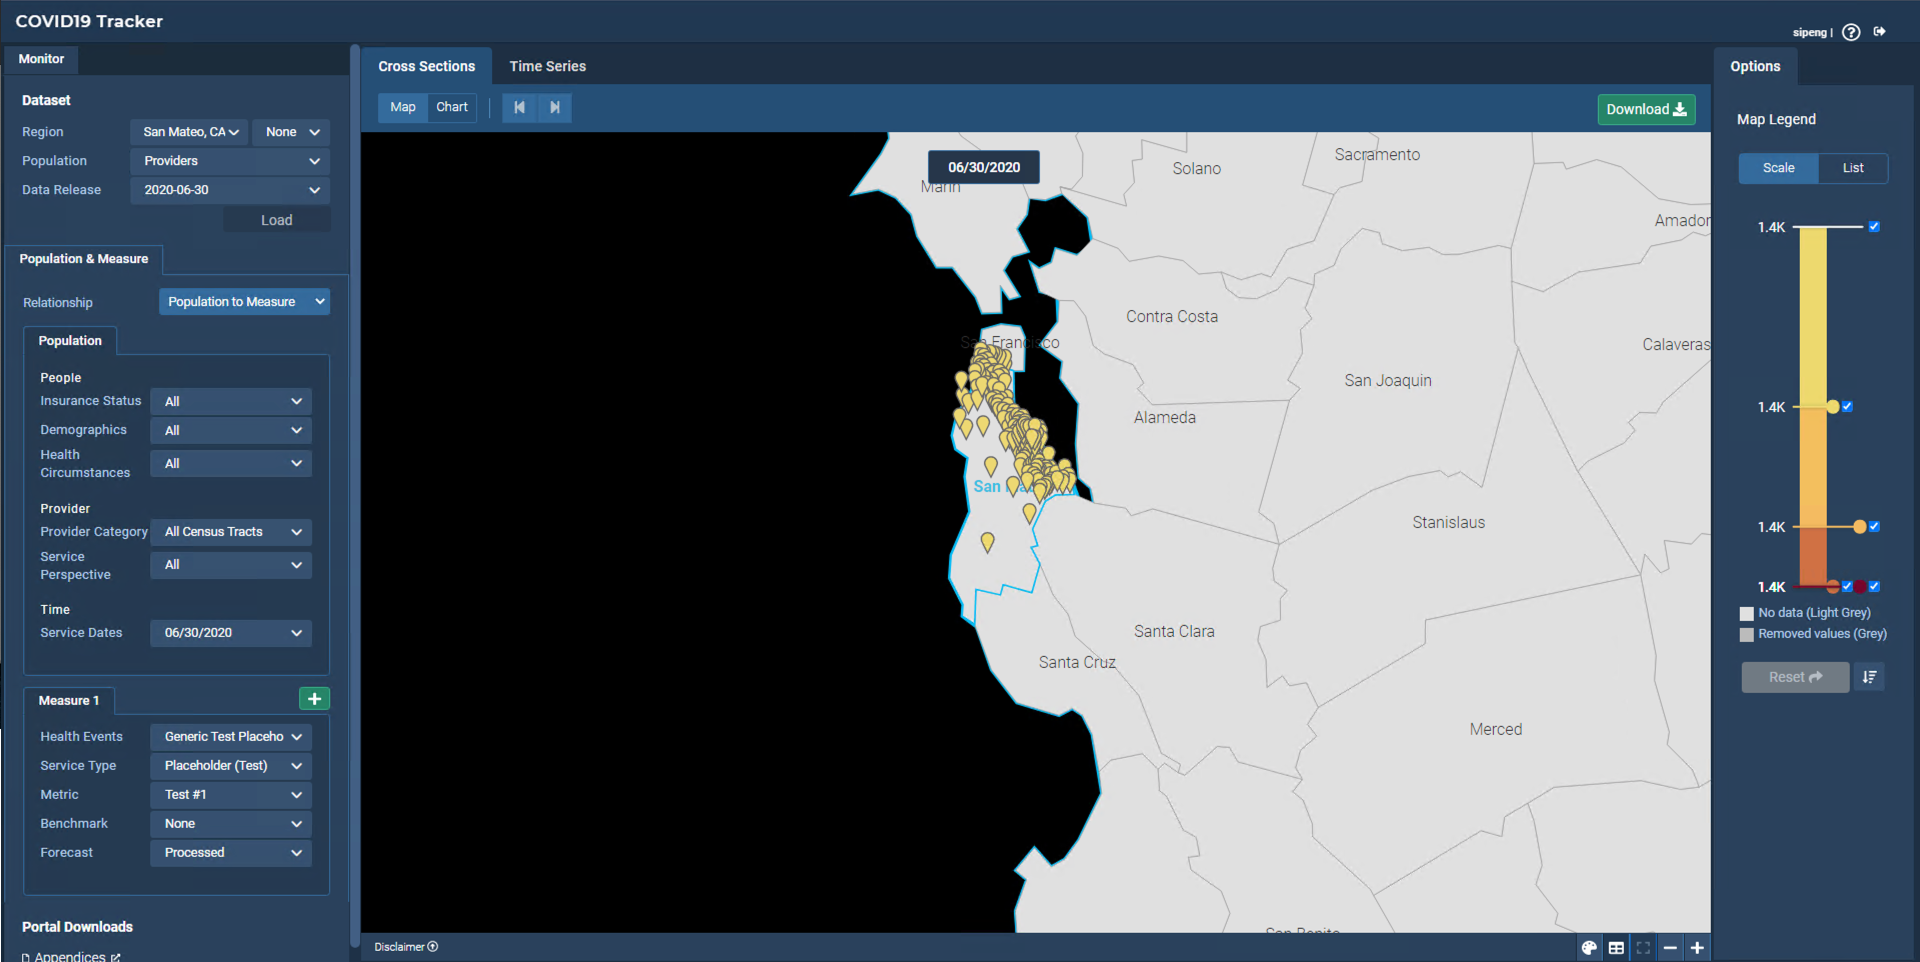
The page visualizes the spatial distrubution of any metrics.
Map is created using D3.js. Color coding is implemented to visualize the data behind.

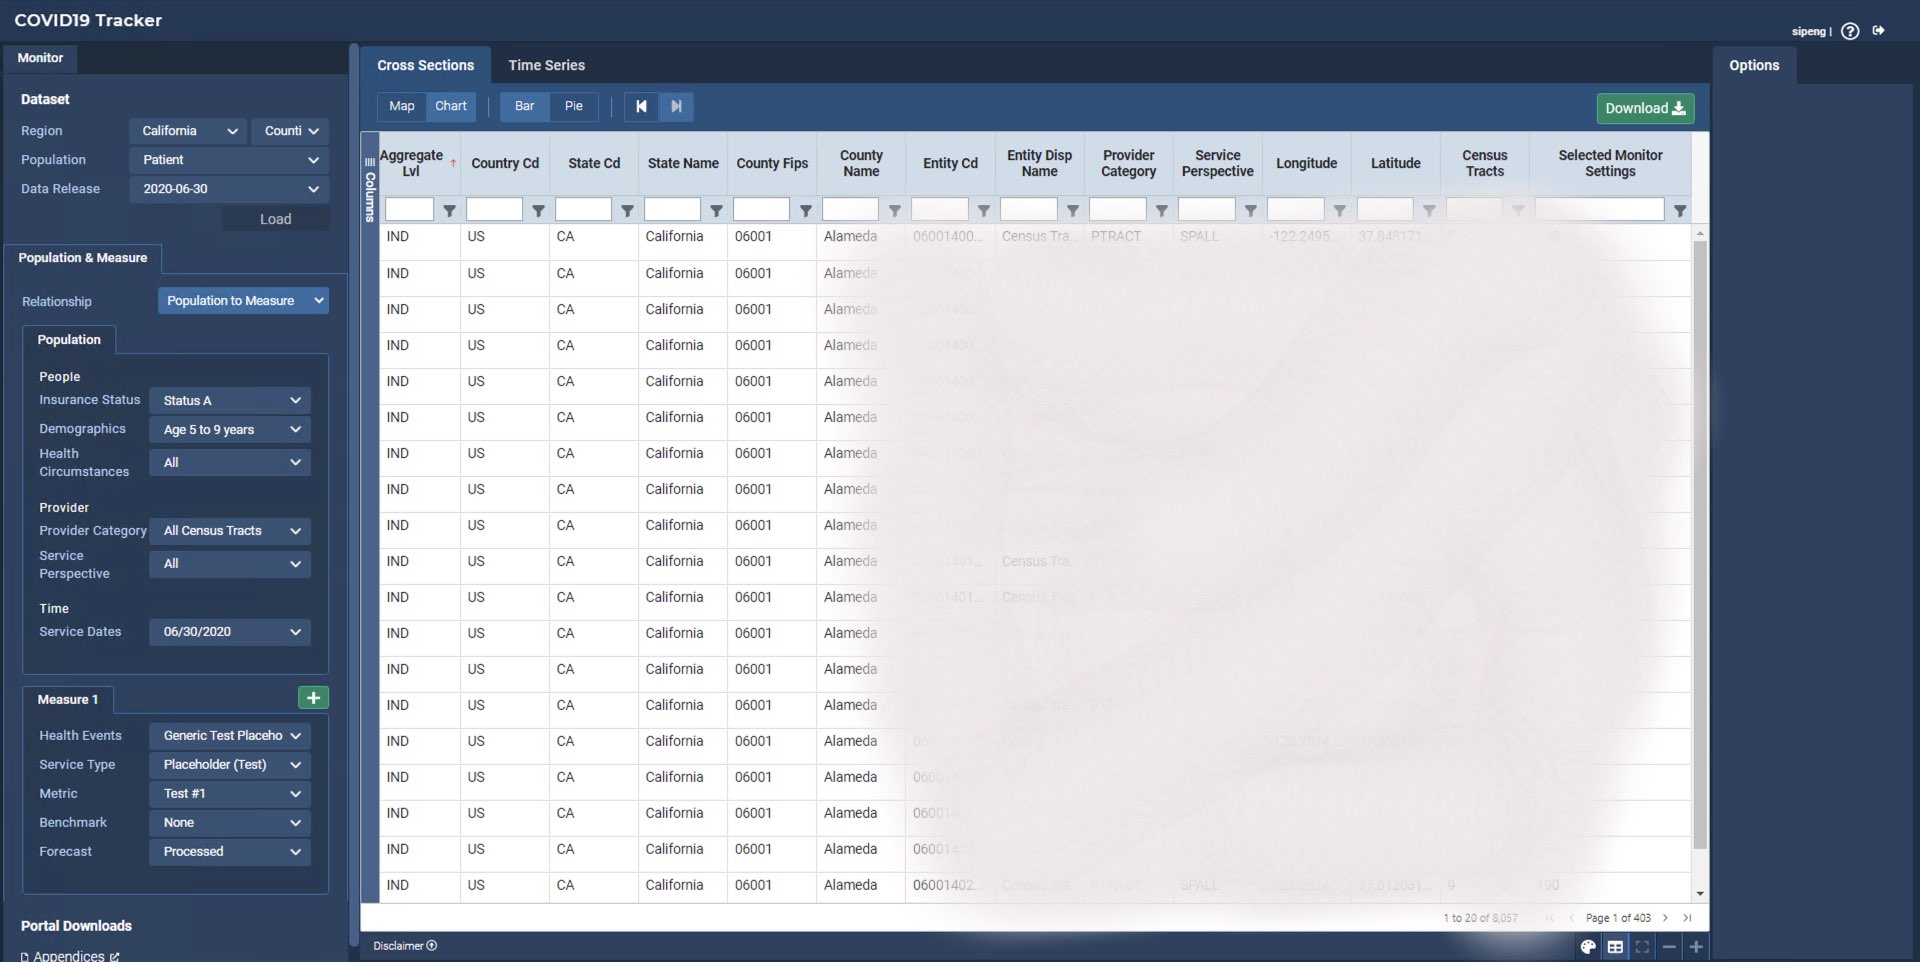
This page is the table display of metrics.
Table is developed using ag-Grid library. Because of the huge data size of table, I choose lazyloading of table data by only requesting
necessary data list from database and trigger data AJAX call every time when there is a data change or user interaction. Sorting model, filtering model and pagination
are carried as parameters with Axios post request.
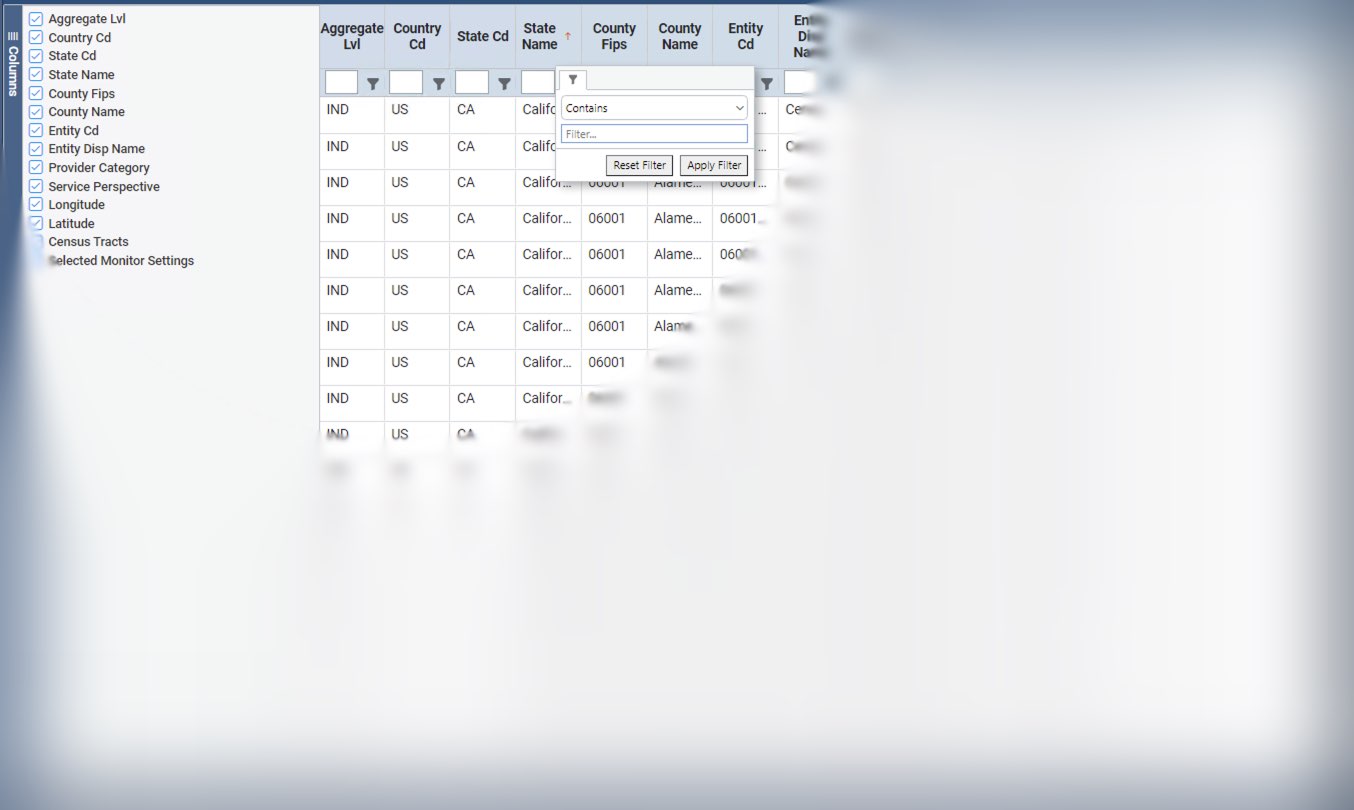
The table supports a bunch of features, including:
Column selectin, custom filtering, sorting, column widening and dragging, page jumping, etc.
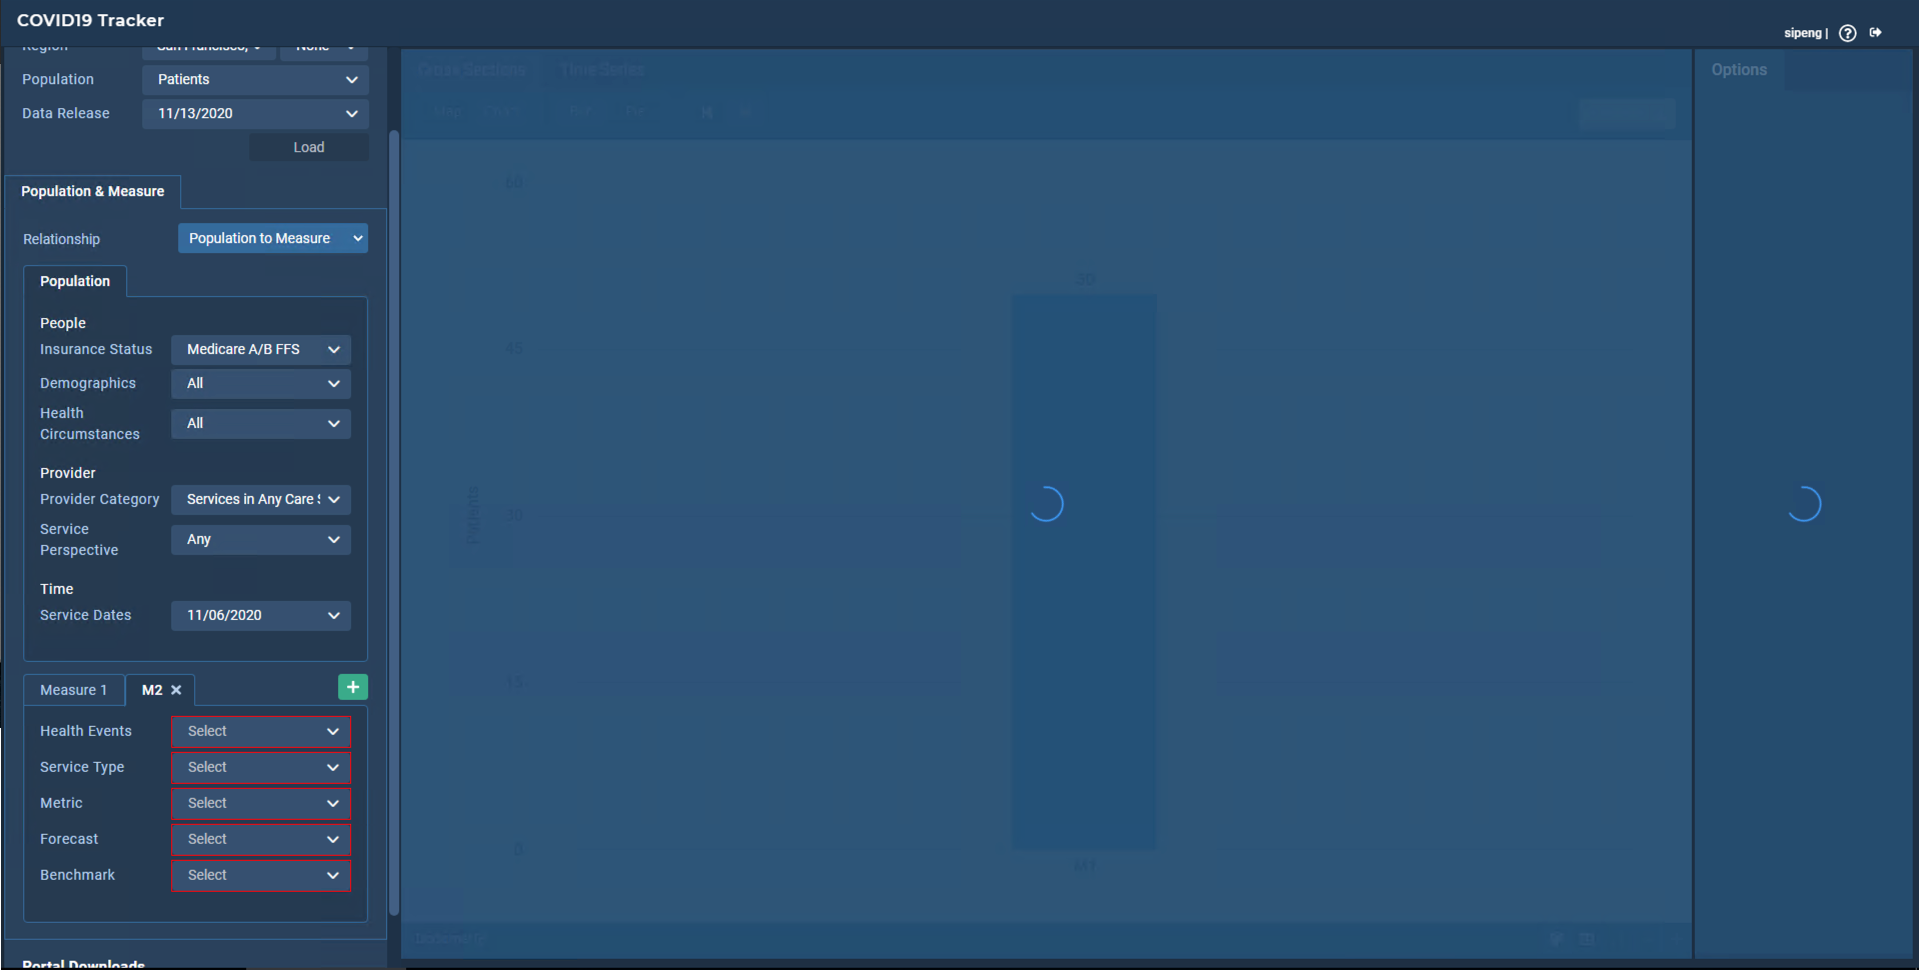
While user is in the process of making selections, the mask is implemented in the display section as the visual cue for the user indicating the pending status.
Once user complete selection, mask will be removed, data calls for visualizations, tables will start.