Provider Profile Tool
Introduction
One of the projects that I worked on as a core developer while working in Acumen LLC is Provider Profile Tool. This tool is a central host of phyisician and providers profiles, connecting multiple analysis and visualization projects for healcare investigations.
My Role In This Project
I am involved in designing, visualization creating, UI components creating, page and function development for this product.
Tech Stack
- Javascript
- D3.js for the interactive visualizations
- Vue.js, Vuex and Vue-Router
- Webpack
- Bootstrap and ElementUI
- ag-Grid for table
- PostgreSQL
- Git and Github for version control and team collaboration
- Upsource for code review
- Jira for task tracking and Agile process
- Confluence for documentation
Screenshot of current work:
Due to greater data security, unfortunately I am not able to public the data, and functional graphic.

Key Takeaways

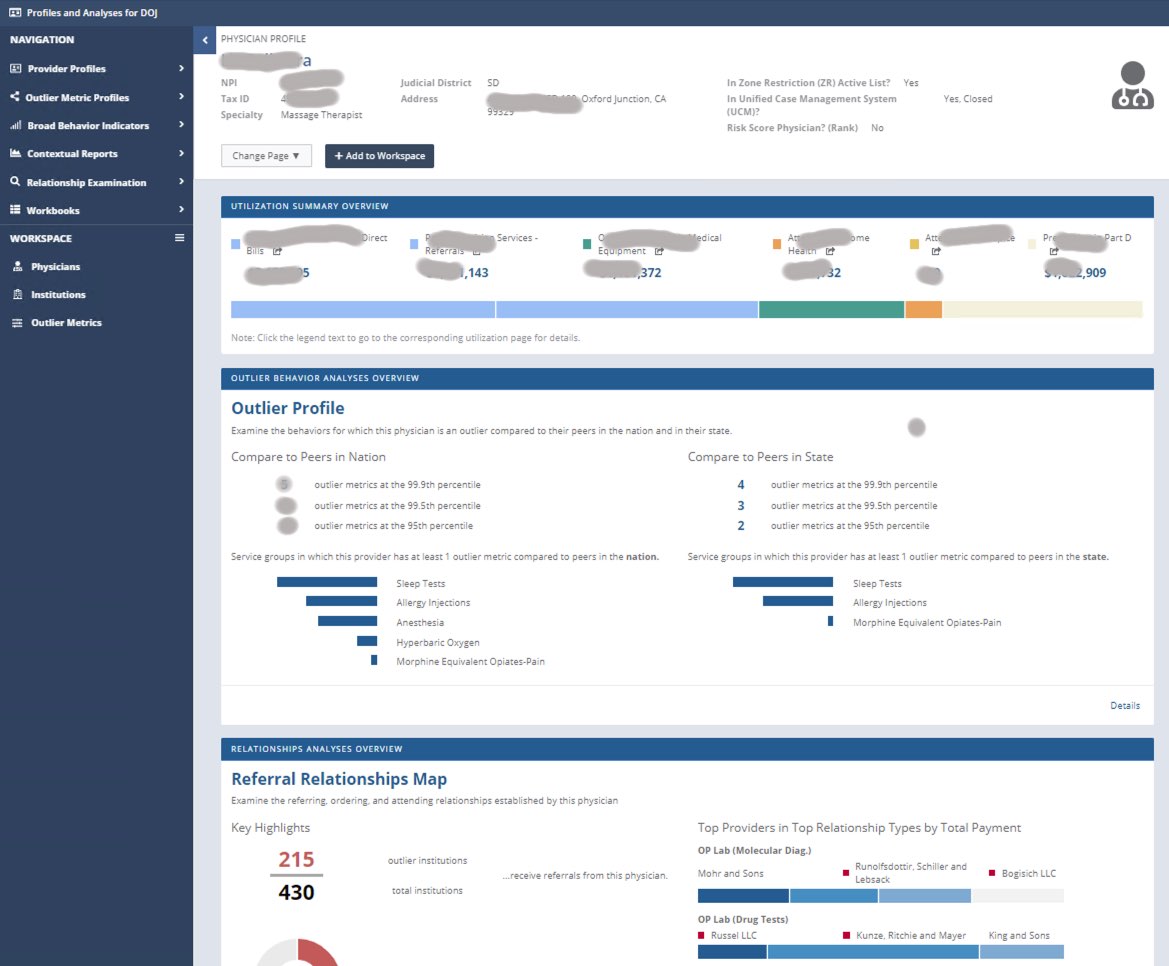
This is the summary page of selected profile. It contains multiple panel and each panel is a reusable component that contains the summary and visualized statistic information of analyses.

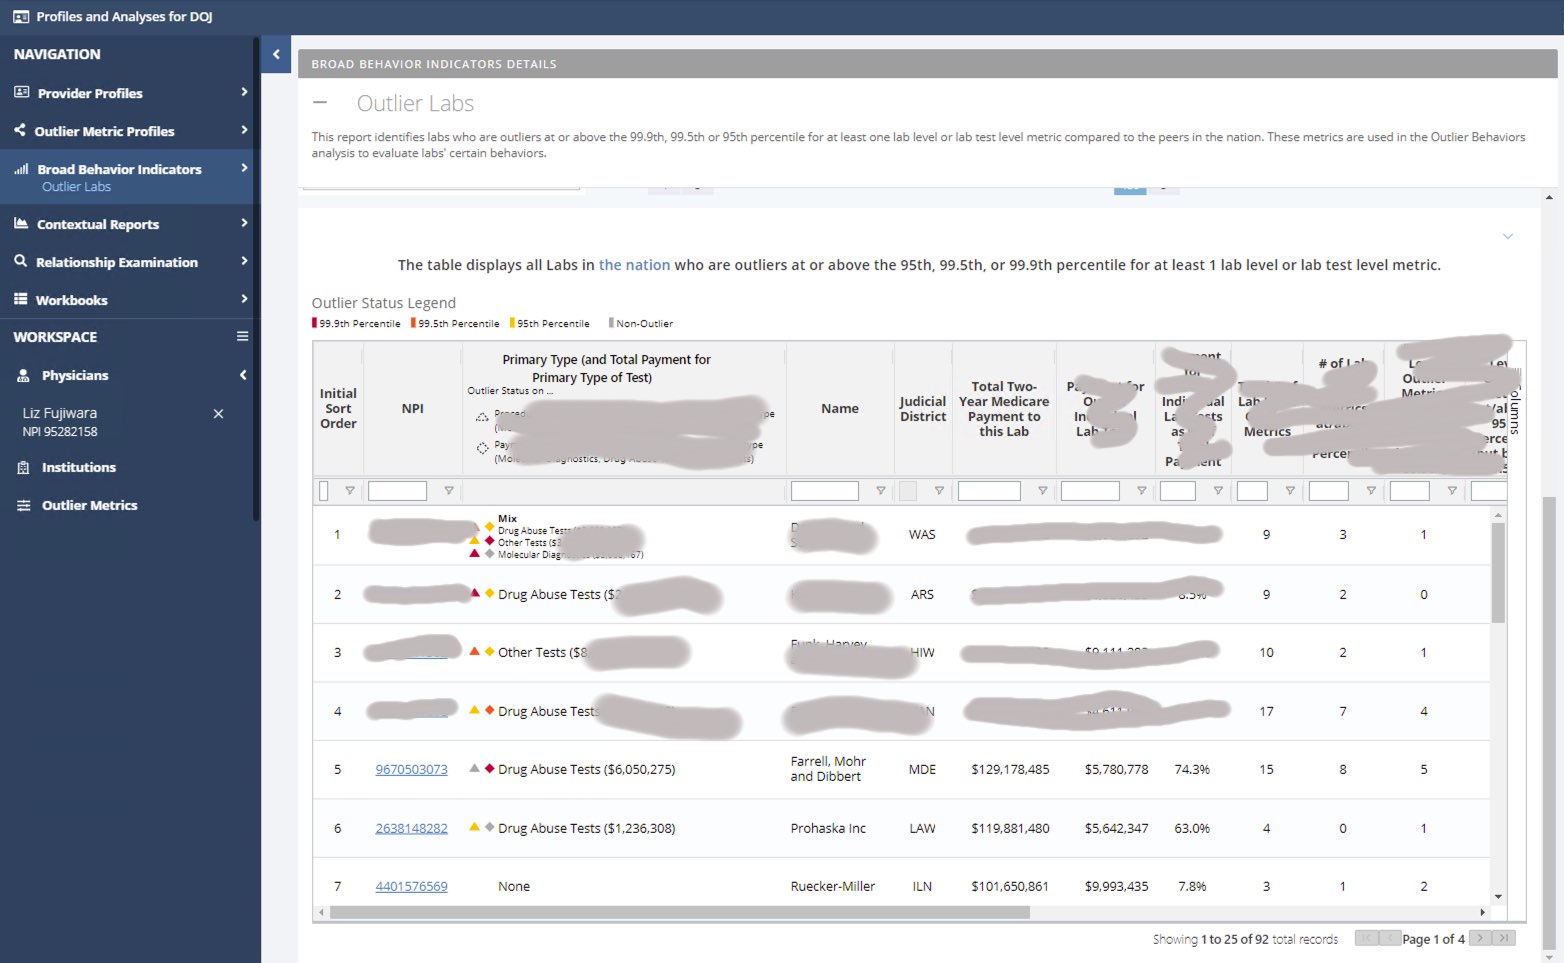
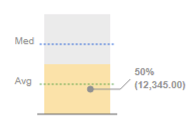
This page is the table display of metrics.
Table is developed using ag-Grid library. Custom table header and column cell component are create in order to
fit the visualization requirement according to client's requests.

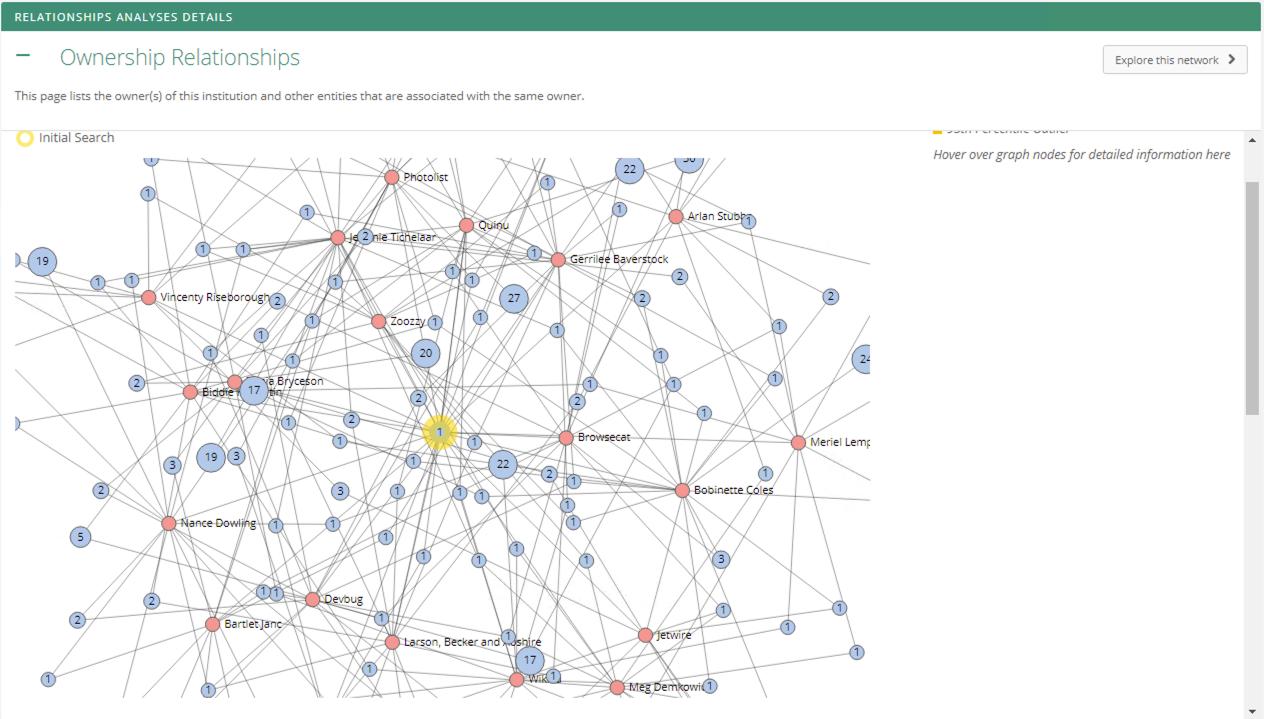
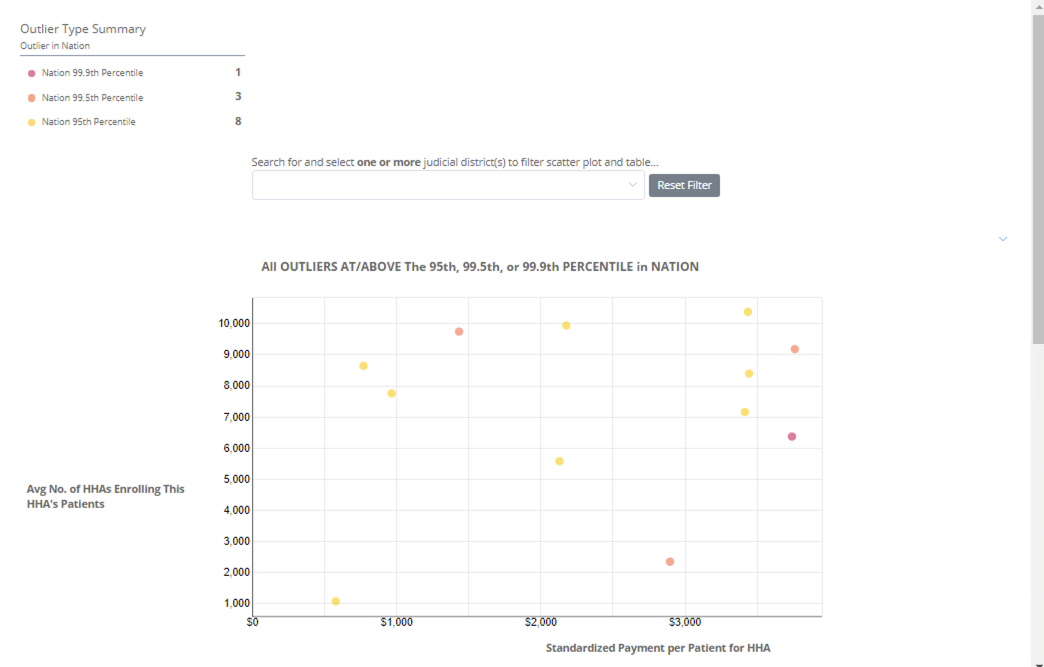
This screenshot shows a page that for a certain metric, the scattorplot of individuals. This scattorplot is developed using D3.js.

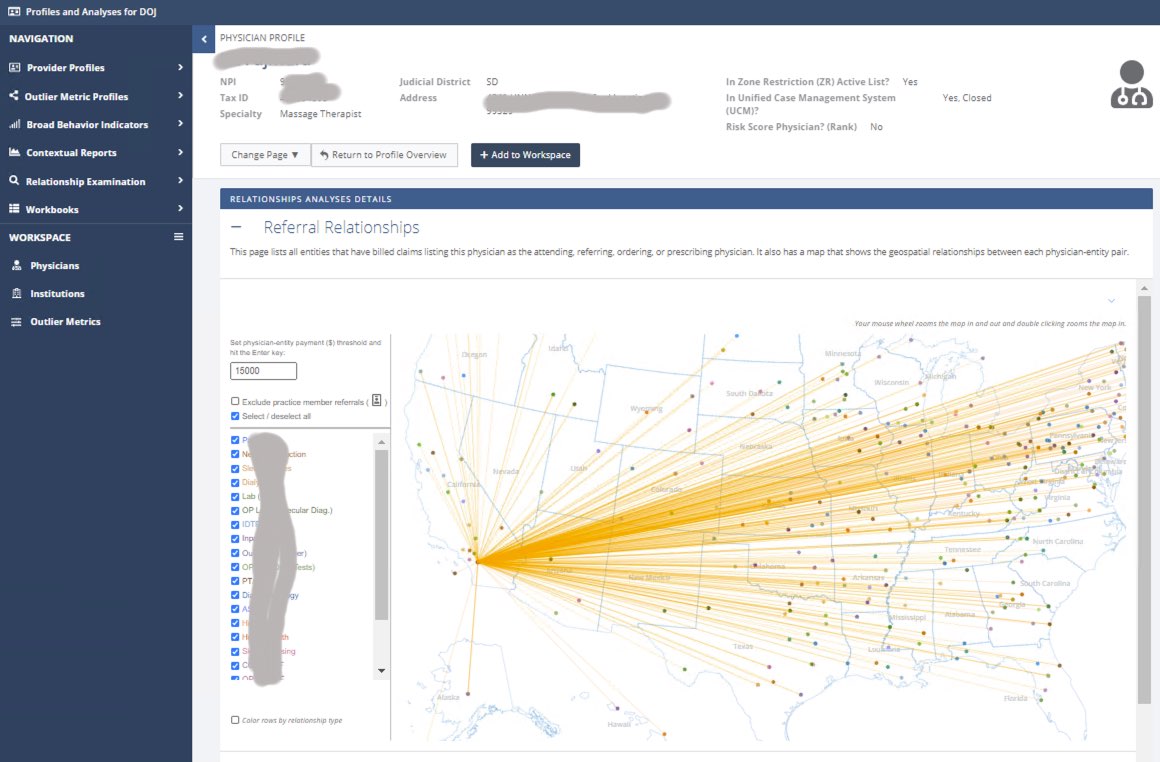
This screenshot shows the geographic locations of entities which are represented as color coded dots and their relationships with the selected entity as the central.